A reasonable diagnostic/prognostic test should not be prone to error when unseen case is presented for screening!
Introduction
Important efforts are developing ways to design and build landmark longitudinal data-cohorts for personalized/precision medicine research:- Diseases/Cancers, to improve our ability to understand better, prevent and treat disease based on individual differences in lifestyle, environment and genetics.
- Health/Wellness, to increase an individual’s chances of remaining healthy throughout life.
The characterization of these sub-groups will be facilitated by using a number of tests based on features associated to clinical, molecular, imaging, sensor, self-reported, behavioral, psychological, environmental and genetic/genemics and so on. A score from a regression of these potential factors(biomarkers) or some other model to characterize the sub-groups can also be used as one unified biomarker, let's called diagnostic/prognostic test.
When well-integrated, the preprocessed data related to these tests is expected to provide an estimation of the difference in the survival of two prognostic subgroups in the single survival population at any given time.
-
This difference in the survival of two prognostic subgroups in the single survival population is the most appropriate in a clinical setting. Therefore, it can be more useful for determining the optimal cut-point of the continuous diagnostic/prognostic test that best discerns between individuals with disease or not.
Difference in the Survival and the Specificity-Sensitivity-Prevalence Impacts
Mathematically and statistically, the difference in the survival depends directly on how well the two groups are separated by the diagnostic/prognostic test. The two measures that are commonly used to evaluate the performance of screening tests are the sensitivity and specificity of the test. The sensitivity of the test reflects the probability that the screening test will be positive among those who are in positive group. In contrast, the specificity of the test reflects the probability that the screening test will be negative among those who, in fact, are in negative group.The standard definitions of sensitivity and specificity consider disease status and marker value for sample as time-independent (firmly fixed). Interestingly enough, both the disease status and marker value may change over time, samples considered as disease-free earlier may develop the disease later due to longer study follow-up, and also their marker value may change from baseline during follow-up.
We comprehensively review the definitions of sensitivity and specificity for prognostic modeling and it is in time-dependent medical status.
A potential third parameter, that may be explicitly/directly involved under specific cases related to the magnitude of the sensitivity and specificity, is the rates of the negative and positive patients in the single survival population. This third parameter is called “Prevalence” and numerically defined as the proportion of positive/negative samples in the overall single survival population. In longitudinal study, the survival rates of the single survival population at a given time is function of the prevalence.
Note that the sensitivity and specificity values are not necessary related to the prevalence rates, specially if the sensitivity and specificity values are computed/estimated from an ad hoc cohort study (assuming not inherently biased**). These estimated sensitivity and specificity values are used to estimate the actual difference in the survival of two prognostic subgroups in the single survival population taking into consideration the prevalence of the disease in this single survival population. Then only when the prevalence is defined perfectly, an estimation of the actual difference in the survival of two prognostic subgroups can be calculated or evaluated.
**The estimated sensitivity and specificity values from an inherently biased cohort study will just provide a biased evaluation to the actual difference in the survival.
Our research questions:
- What are the the magnitude of the sensitivity and specificity values that make the difference in the survival rates of the two prognostic subgroups not explicitly depending on the prevalence(survival rates of single survival population)?
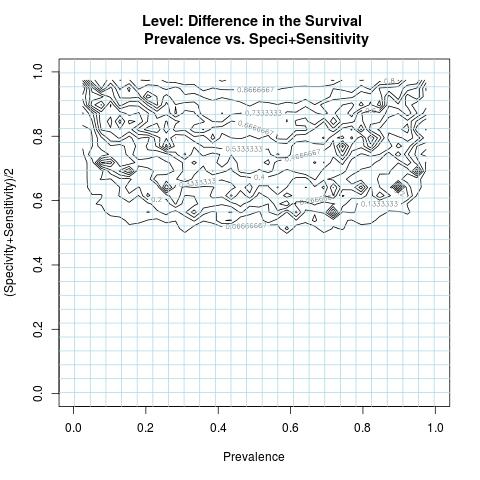
- Highlight specific contour levels of the difference in the survival, i.e. its intrinsic formulation to the variables( Specificity & Sensitivity ) and parameter(Prevalence).
Mathematical/Statistical Models
The Mathematical/Statistical models in this interesting work are used to describe the difference in the survival of two prognostic subgroups at any given time in terms of equations involving variables( Specificity & Sensitivity ) and parameter(Prevalence) representing the main aspects of the difference in the survival. We comprehensively review this interesting work in the companion of this essay time-dependent medical status.Importantly enough, in this essay we will address the concern of the Author about how the prevalence affects the difference in the survival and to what extent?
The analytical form of the difference in the survival(DiS) is given by:
DiS = A / (B*C) ... (*)
A = prevalence*(1-prevalence)*(specificity+sensitivity-1)
B = sensitivity*prevalence+(1-specificity)*(1-prevalence)
C = (1-sensitivity)*prevalence+specificity*(1-prevalence)
Its formulation shows that the prevalence is to play a role in the bias of many outcome measures for test performance. For highly skewed prevalence rates, adequate sample sizes in the true positive and negative groups are needed for reliable estimates of the sensitivity and specificity values.
It is remarkable that when the magnitude of the sensitivity and specificity values are higher to one, the difference in the survival can be well-approximated as:
(specificity+sensitivity-1)/(specificity*sensitivity)
Given a test high in specificity and high in sensitivity helps to achieve a higher or adequate difference in the survival not explicitly depending on the prevalence. The maximum of the function DiS is equal to one which is also attainable when the magnitude of the sensitivity and specificity values are close to one.
Informatics Solution
A numerical simulation is conducted to study the numerical behavior of the function DiS in (*), as in most nonlinear formulations to assess min/max proprieties, using a number of sampled values representing all possible outcomes related to the variables( Specificity & Sensitivity ) and parameter(Prevalence). This computer simulation is used to explore and gain new insights into the impact of the variables( Specificity & Sensitivity ) and parameter(Prevalence) and to estimate and highlight specific contour levels of the function DiS as result of its nonlinear formulation to the variables( Specificity & Sensitivity ) and parameter(Prevalence). For visualization purpose, the DiS negative values are replaced by zero.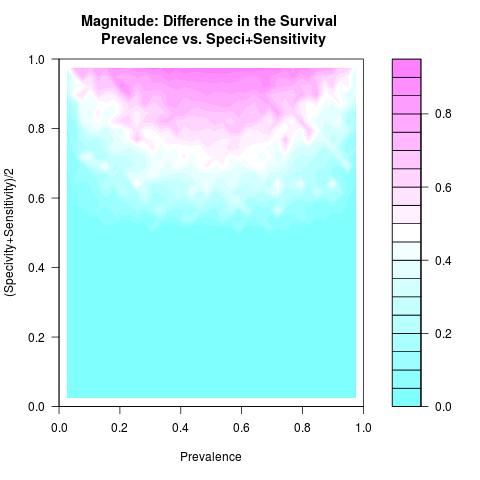
Discussion & Conclusion
As long as the prevalence is not very low/high and the used test to separate the two groups from a single survival population has both higher specificity and sensitivity values, an adequate difference in the survival of these two prognostic subgroups is attainable and not explicitly depending on the prevalence. In this case, comparing survival curves between two prognostic subgroups is not misleading as the misclassification is minimal.As for the scalability of the difference in the survival where the rates of the specificity and sensitivity values deteriorate, the magnitude of the difference in the survival surely deteriorates as well and specially when the prevalence rate becomes low or high.
Using poor tests** in longitudinal data-sub-cohorts from a single survival population, specially when the prevalence rate becomes low or high, affect baldly and in a nonlinear relationships the precision of the study. ** The tests(toys) failed to understand that the biological case of the study is substantially complex. Or the tools used to collect, organize, pre/post processing data contents are just messy to help shaping tests that can discern or to predict.
It is essential to combine this information with research analysis tools, i.e. to improve specificity & sensitivity by developing suitable Quality Control and Quality Assurance for the tools used in the designed diagnostic/prognostic tests.
The personalized/precision medicine to be efficient needs sound approach to clinical trials and Informatics Solution. Our system biology is immensely complex and may be less predictable by just insisting on replicating blindly policies and engineered methods that succeeded in the other fields as computer sciences/internet search and so on!
Future Work
Impact of censoring on the used formulations to estimate the sensitivity and specificity values and by consequent on the difference in the survival, is in difference in the survival in the presence of censoring.Author scientific profile:
Statistics and Applied Mathematics for Data Analytics, Identify opportunities to apply Mathematical Statistics, Numerical Methods, Machine Learning and Pattern Recognition to investigate and implement solutions to the field of Data Content Analytics. Data prediction via computational methods to predict from massive amounts of data (Big Data Content). These methods included clustering, regression, survival analysis, neural network, classification , ranking, deep discrepancy learning .opportunity
Author: Faysal.El.Khettabi@gmail.com , Living in Vancouver, BC, Canada.
The MIT License (MIT) Copyright 1994-2017, Faysal El Khettabi, Numerics&Analytics, All Rights Reserved.
The MIT License (MIT) Copyright 1994-2017, Faysal El Khettabi, Numerics&Analytics, All Rights Reserved.