Definitions:
Statistical power is the probability of demonstrating statistical significance if the hypothesis of the study is true.
We assume a continuous diagnostic test(biomarker) to discriminate between non-diseased(negative) and diseased(positive) individuals. For clinical reason, it is useful to select an appropriate discrimination threshold(cut-point) that defines negative and positive test results.
Aim & Motivation
Enrolling a number of participants into a cohort with an adequate statistical power leads to an accurate and reliable process to discover biological markers to signal increased or decreased risk of developing specific diseases. These biological markers provide accurate and reliable predictions to empower study participants or new ones with information to improve their own health. By taking into account individual differences in lifestyle, environment, and biology, these biological markers are the focus of the personalized/precision medicine. The personalized/precision medicine aims to extract a comprehensive scientific knowledge to be tailored to the individual patient using cohort studies with goal to foster understanding of health and disease.In this essay, we consider that the collected cohort has a number of participants from a single survival population that can be separated into two sub-cohorts one with better(healthy state) and the other with worse(developing a non-healthy state) survival prognoses using an hypothetic biological marker that needs to be discovered and assessed during the study.
Several elements may affect the statistical power of cohort, the inherent stochasticity in the participants collection(study design), follow up(censoring), hypothetic biological marker measurements( precise/efficient/accurate technologies), cut-point finding methods and so on.
We provide an Informatics Solution with the potential to mimic a real cohort collection with a goal to simulate scenarios quasi-close to the encountered stochasticity in reality. These simulation scenarios will facilitate a learning knowledge representations for a wide range of variabilities with an end point to form predictive analytics to study the difference in the survival of two prognostic subgroups and to assess its figure of merit as whether they lead to the identification of the optimal cut-point providing the most useful information for the considered cohort study.
Introduction
We are interested by this problem where a medical status, D, is supposed to be positively correlated with a marker M.The first group called positive ( where D=1 ) is expected to have the following condition, M >= m where m is a specific cut-point.
The second group called negative ( where D=0 ) is expected to have the following condition, M < m where m is a specific cut-point.
As a realistic project, we consider the cumulative approach: the marker of interest is measured at baseline and the project is interested in the prognostic properties of the marker up to a specific period of time t, i.e. D(t) == 1 or D(t) == 0.
For this cumulative approach, the sensitivity and specificity for Time To Event, T, are defined as:
- The sensitivity associated to a given cut point m at time t is defined as:
Sen(m,t) =P( M >= m | T <= t) - The specificity associated to a given cut point m at time t is defined as:
Spe (m,t) =P( M < m | T > t)
- the survival of positive group at time t, SurvPositive(t).
- the survival of negative group at time t, SurvNegative(t).
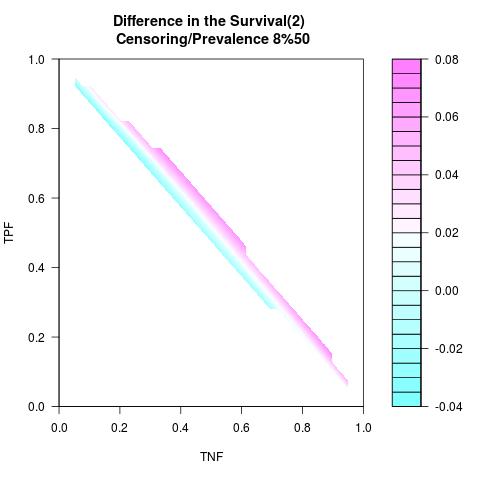
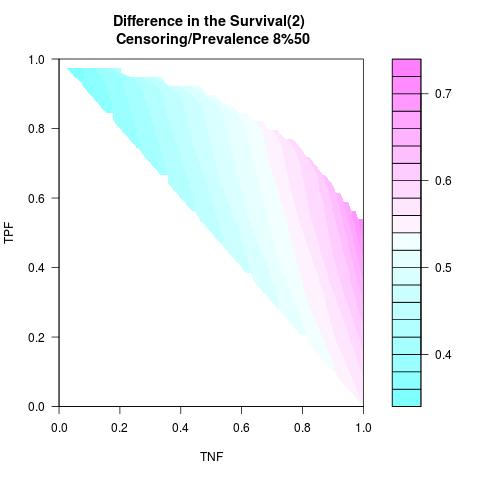
- the difference in the survival at time t, SurvNegative(t) - SurvPositive(t).
- this difference in the survival is the most appropriate in a clinical setting.
The analytical form of the difference in the survival is derived in this interesting work:
DiS(t) = A(t) / (B(t)*C(t))
A(t) = prevalence(t)*(1-prevalence(t))*(specificity(t)+sensitivity(t)-1)
B(t) = sensitivity(t)*prevalence(t)+(1-specificity(t))*(1-prevalence(t))
C(t) = (1-sensitivity(t))*prevalence(t)+specificity(t)*(1-prevalence(t))
(t) is to indicate that these quantities are calculated at time, t.
For a detailed evaluation/analysis of this formulation, see our companion work to this essay: difference in the survival in the absence of censoring.Realistic Scenarios & Numerical Simulation
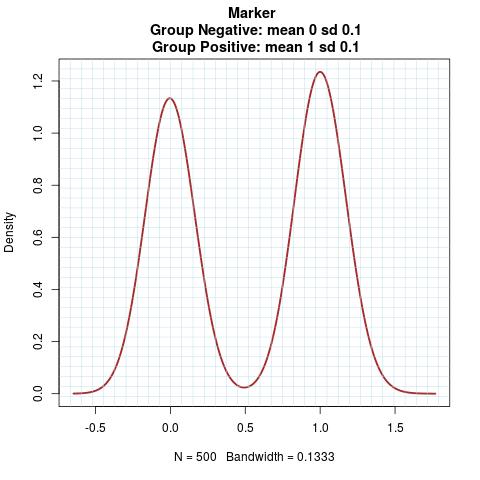
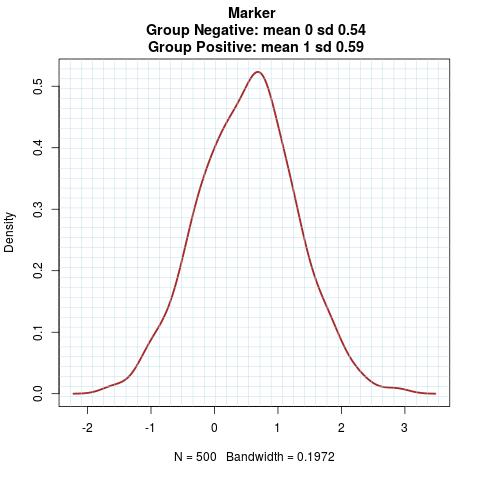
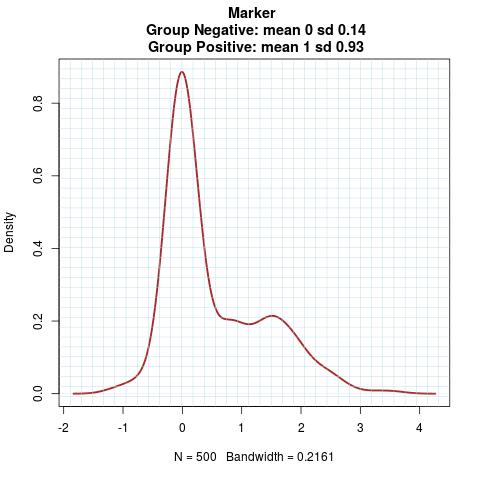
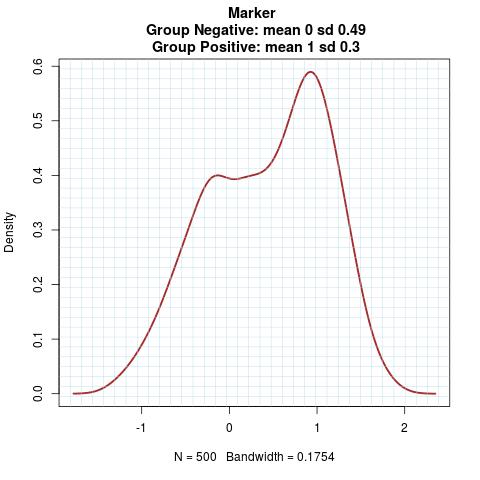
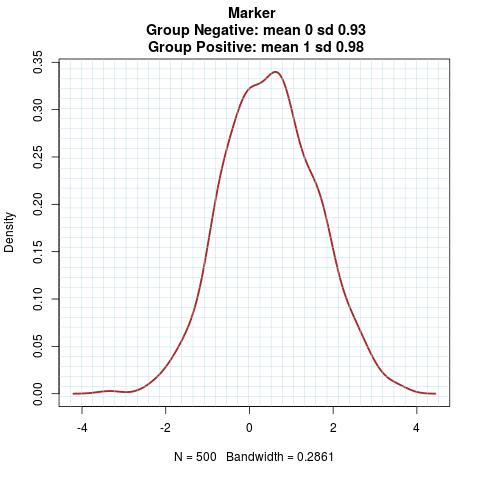
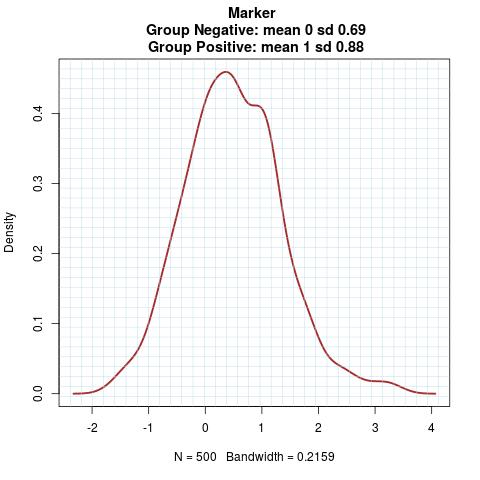
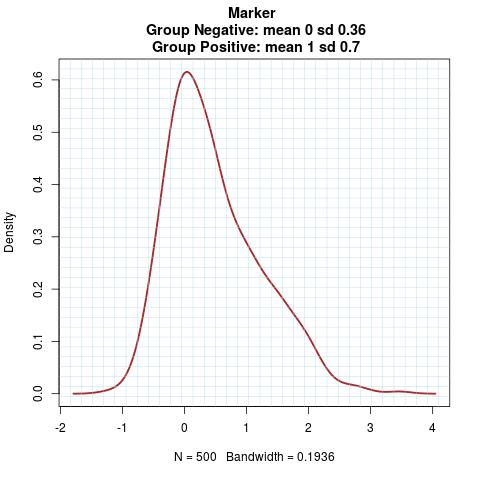
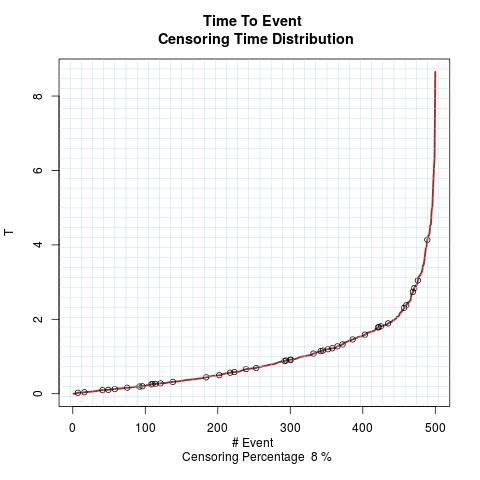
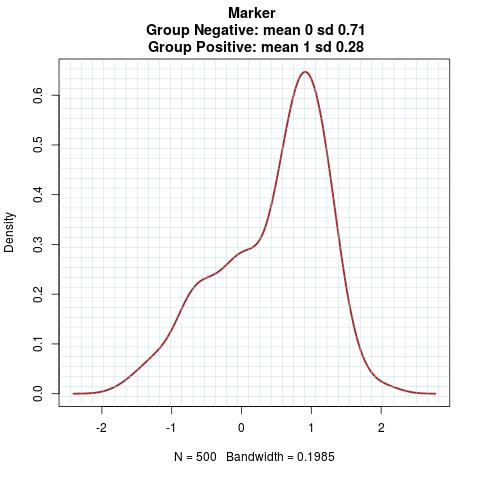
Informatics Solution can be made to predict almost any outcome. It would also generate primordial insights to reassess the cohort formation and consider new ideas about how to improve the cohort formation when challenges are experienced as censoring.A realistic dataset has always censored data and it is not possible to build a cohort standing always with perfect accuracy. We investigate simulation scenarios using datasets that mimic realistic dataset. We consider that the marker is a mixture of two Normal distributions, we assess the following points:
- Simulation/Visualization as an effective way to show the results given a number of values for the variables and parameters.
- Estimating the numerical values associated to the difference in the survival given a number of cut-points.
- Feasibility to identify the best cut-point and so on.
Example 0
Marker Pattern:
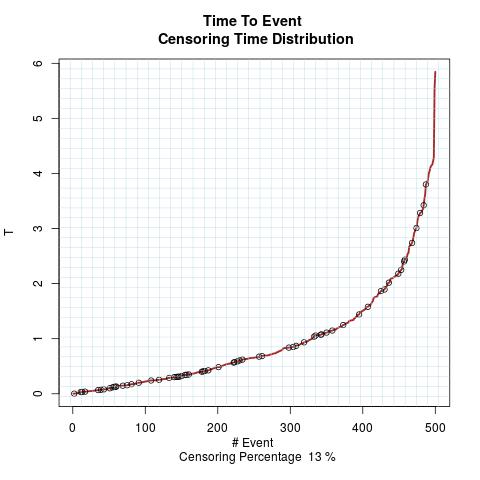
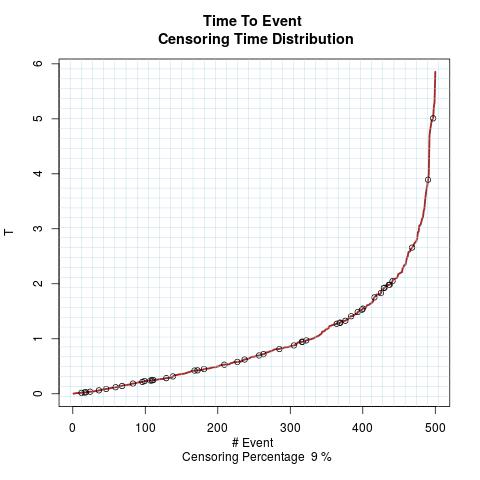
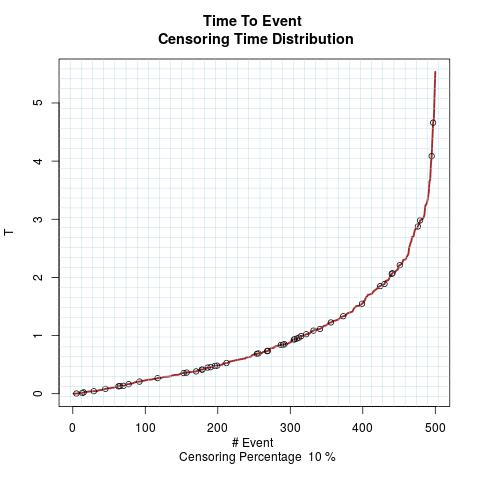
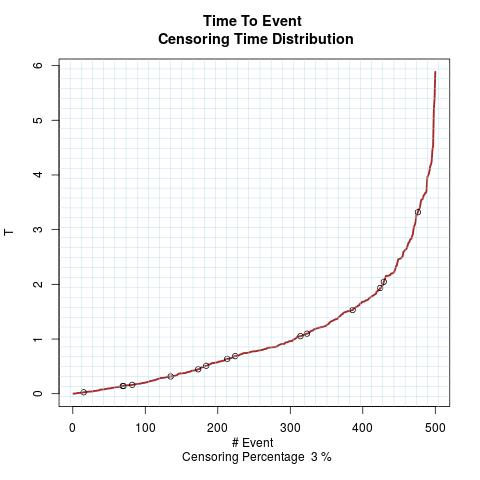
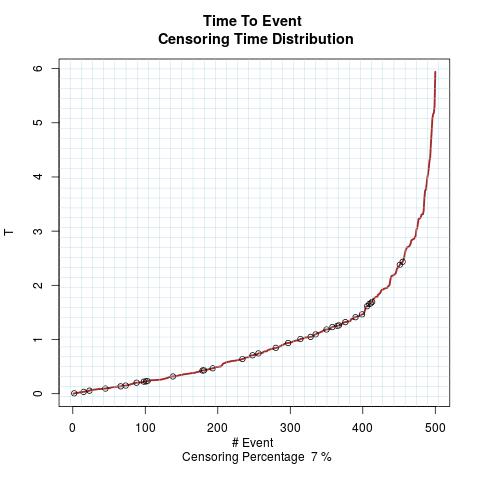
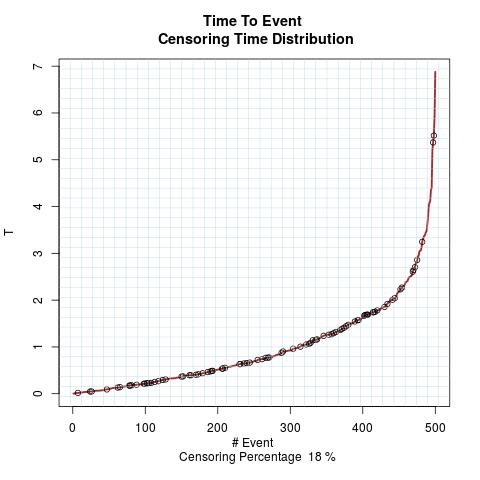
Time to Event Distribution:
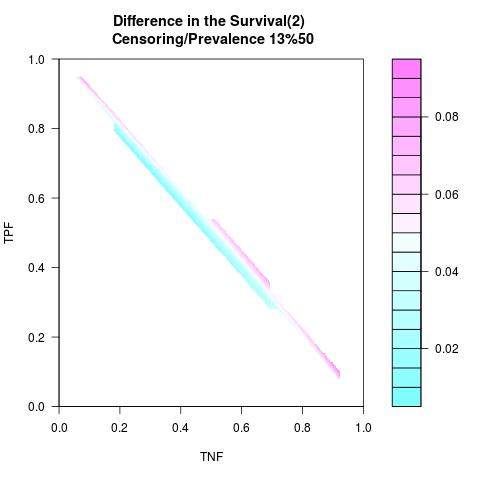
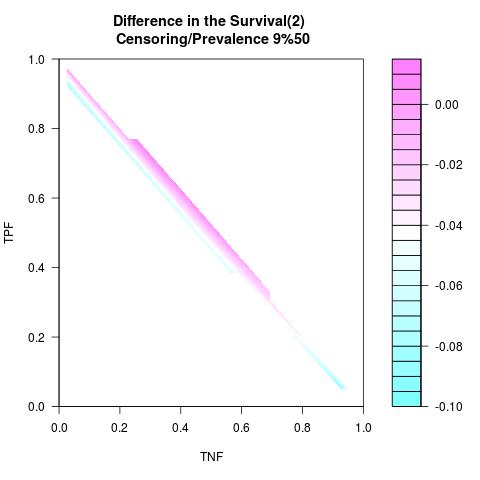
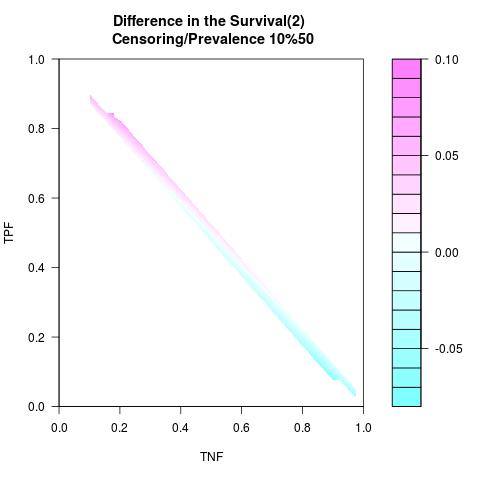
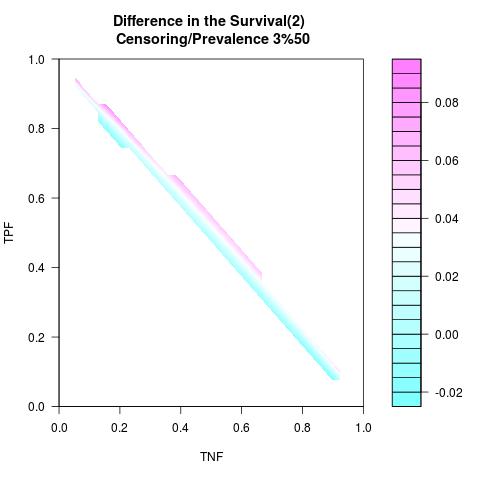
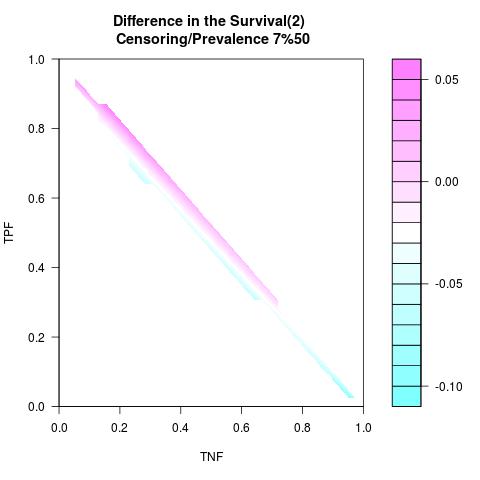
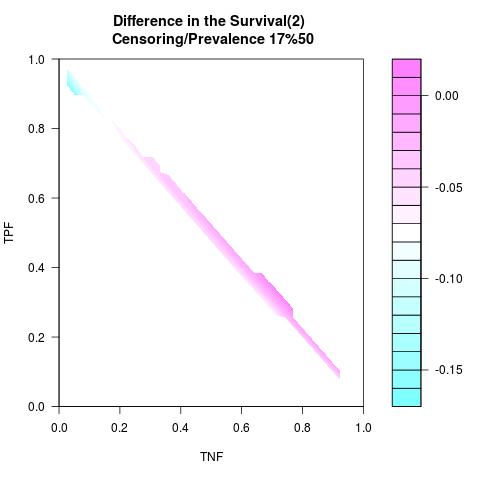
Randomly Correlated with Time to Event: the color-map shows the value of the index associated to TPF/TNF given a specific cut-point
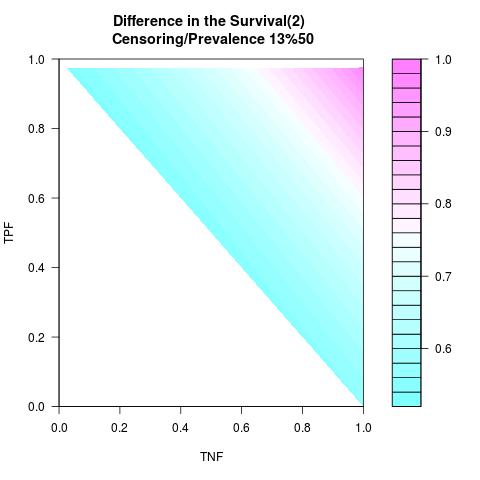
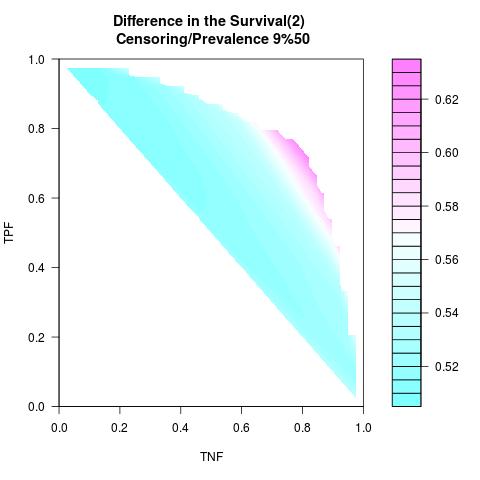
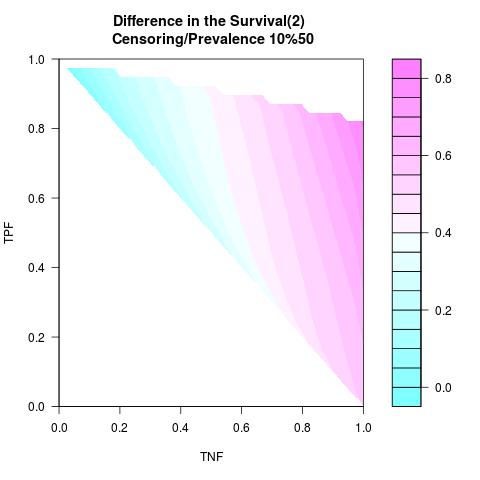
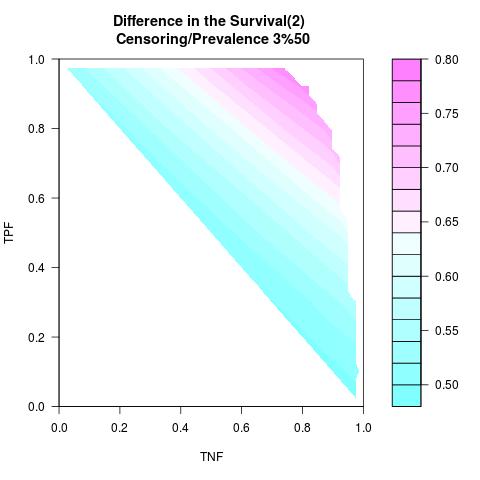
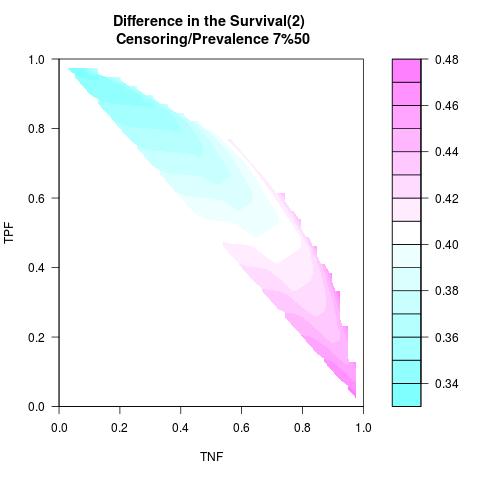
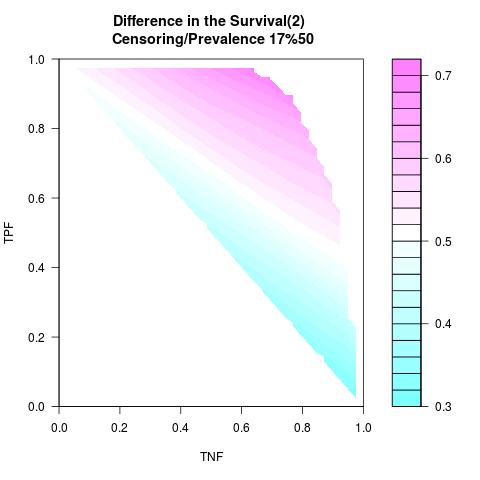
Supposed Correlated with Time to Event: the color-map shows the value of the index associated to TPF/TNF given a specific cut-point
Example 1
Marker Pattern:
Time to Event Distribution:
Randomly Correlated with Time to Event: the color-map shows the value of the index associated to TPF/TNF given a specific cut-point
Supposed Correlated with Time to Event: the color-map shows the value of the index associated to TPF/TNF given a specific cut-point
Example 2
Marker Pattern:
Time to Event Distribution:
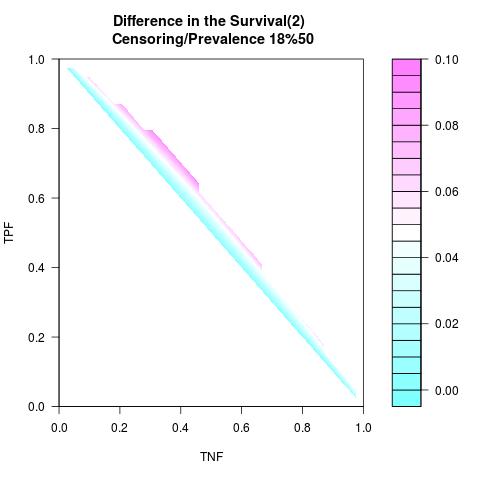
Randomly Correlated with Time to Event: the color-map shows the value of the index associated to TPF/TNF given a specific cut-point
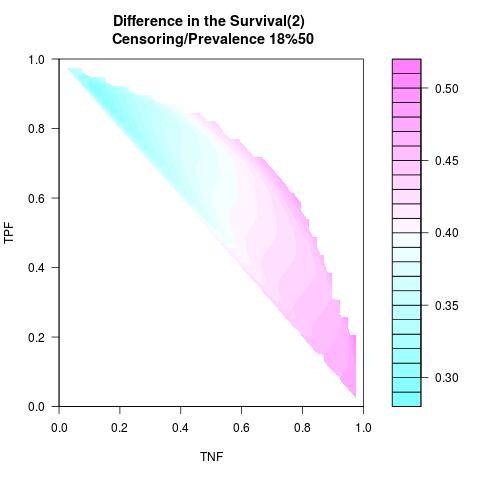
Supposed Correlated with Time to Event: the color-map shows the value of the index associated to TPF/TNF given a specific cut-point
Example 3
Marker Pattern:
Time to Event Distribution:
Randomly Correlated with Time to Event: the color-map shows the value of the index associated to TPF/TNF given a specific cut-point
Supposed Correlated with Time to Event: the color-map shows the value of the index associated to TPF/TNF given a specific cut-point
Example 4
Marker Pattern:
Time to Event Distribution:
Randomly Correlated with Time to Event: the color-map shows the value of the index associated to TPF/TNF given a specific cut-point
Supposed Correlated with Time to Event: the color-map shows the value of the index associated to TPF/TNF given a specific cut-point
Example 5
Marker Pattern:
Time to Event Distribution:
Randomly Correlated with Time to Event: the color-map shows the value of the index associated to TPF/TNF given a specific cut-point
Supposed Correlated with Time to Event: the color-map shows the value of the index associated to TPF/TNF given a specific cut-point
Example 6
Marker Pattern:
Time to Event Distribution:
Randomly Correlated with Time to Event: the color-map shows the value of the index associated to TPF/TNF given a specific cut-point
Supposed Correlated with Time to Event: the color-map shows the value of the index associated to TPF/TNF given a specific cut-point
Example 7
Marker Pattern:
Time to Event Distribution:

Randomly Correlated with Time to Event: the color-map shows the value of the index associated to TPF/TNF given a specific cut-point
Supposed Correlated with Time to Event: the color-map shows the value of the index associated to TPF/TNF given a specific cut-point
Author scientific profile:
Statistics and Applied Mathematics for Data Analytics, Identify opportunities to apply Mathematical Statistics, Numerical Methods, Machine Learning and Pattern Recognition to investigate and implement solutions to the field of Data Content Analytics. Data prediction via computational methods to predict from massive amounts of data (Big Data Content). These methods included clustering, regression, survival analysis, neural network, classification , ranking, deep discrepancy learning .
Author: Faysal.El.Khettabi@gmail.com , Living in Vancouver, BC, Canada.
The MIT License (MIT) Copyright 1994-2017, Faysal El Khettabi, Numerics&Analytics, All Rights Reserved.
The MIT License (MIT) Copyright 1994-2017, Faysal El Khettabi, Numerics&Analytics, All Rights Reserved.