Aim and Motivation: Convert Data-Lights into Meaningful Insights.
Our aim is to illustrate how to use our Discrepancy Imaging Analytics to analyze Stimulated emission depletion (STED) microscopy images.As illustration, we use this interesting recently published work "Optical High Content Nanoscopy of Epigenetic Marks Decodes Phenotypic Divergence in Stem Cells" that demonstrated a new way to identify the state and fate of individual stem cells earlier than previously possible. Stem cells can develop into different cell types. They may offer a renewable source of replacement cells to treat diseases, conditions, and disabilities, i.e. serving as building blocks for the various tissues and organs of the body to cure or reduce the severity in case of a disease or disorder. Stem cell and regenerative medicine research hold a great deal of promise. Understanding and accurately defining a stem cells phenotypic divergence are essential (absolutely necessary) for using stem cells in life saving therapies, improve overall health and quality of life.
The approach in the cited work is called EDICTS (Epi-mark Descriptor Imaging of Cell Transitional States), the work used the optical high content nanoscopy of histone epigenetic marks (epi-marks) in stem cells to classify emergent cell states, i.e. involves imaging the labeled epigenetic modifications using microscopes capable of super resolution imaging as Stimulated emission depletion (STED) microscopy images.
The main hypothesis in this EDICTS, " the phenotypic divergence in stem cells can be linked to the perturbation of gene organizational domains within the nucleus, which can be detected and parametrized to the extent that the derived parameters can forecast a specific lineage choice."
The work also considered that the observed changes in the collected lights during a number of time-periods are faithful representation of histone epigenetic marks modifications (chromatin reorganizations) and not "dramatically" biased by the cell-living/nucleus dynamics, imaged side changes due to random elongation & 3D-rotation & shifts, during the process of recording/sampling spots(small groups of individual nucleosomes) to construct the images.
The constructed images have the following characteristics:
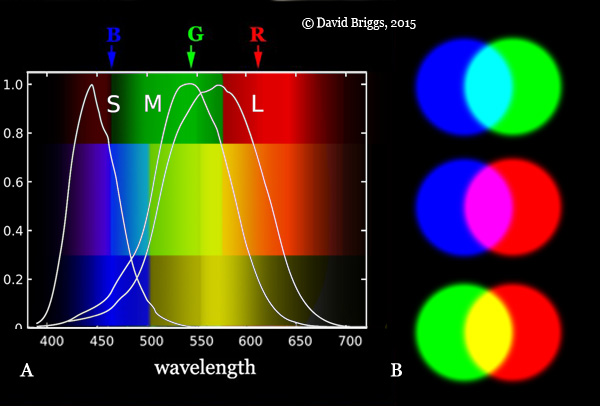
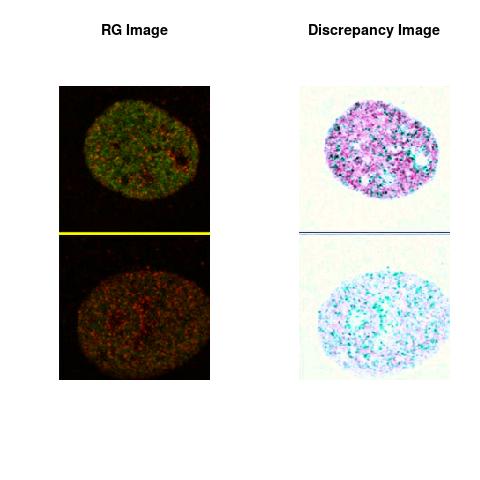
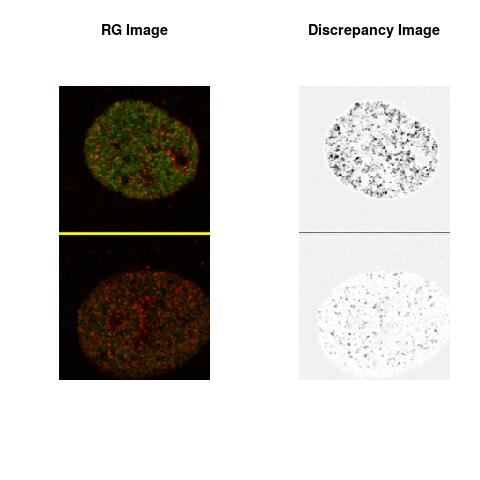
- The red color represents H3K27me3, the green color represents H3K4me3 and the blue color is redundant in the color-space of the image.
- The resolution of single pixel units correspond to the occupation of 1–4 nucleosomes.
In this essay, we are mainly motivated to test and assess the utility of our recent developed software Fluorescence Imaging Analysis Using Deep Discrepancy Learning Process to automatically quantify the most informative and relevant features contained in the primary image generated by EDICTS.
We consider our recent developed software as a practical way of looking at third order texture. The framework is based on the mathematical formulation of L2 discrepancy that measures the pixel-colors presence in all multiresolution-subrectangles defining the color-space, i.e. captured lights in the image and is providing an indication, without loss of spatial information, related to how the pixel-colors are globally scattered in the color-space. The L2 discrepancy value captures the global degree of discrepancies in color-space and enables the formulation of a Deep Discrepancy Learning Process.
This Deep Discrepancy Learning Process (DDLP) is scalable and makes use of the totality or partially the provided channels in the primary image and is simple to numerically implement without assuming any parametric form in the primary image data contents. The results showed that it captured the reflected pattern in the image with more insights about the colors spatial distribution where the pixel colors are either clumped or scarce, see IFC Using DDLP.
The DDLP defines image information content as a set of descriptors/covariantes of the primary image color-space structures. Many levels of descriptors are provided:
- Pixel-level descriptors, the colors spatial distribution where the pixel colors are either clumped or scarce. Hence creating one histogram for multi-variable data, i.e. a plot to discover, and show, the underlying frequency distribution of a set of continuous data (RGB colors). We refer to these Pixel-level descriptors as Sensitivity Descriptors.
- New companion Discrepancy Images to the primary image are formed using Pixel-level descriptors. See Fluorescence Imaging Analysis Using Deep Discrepancy Learning Process.
- Global level parameters outlining the entire light scattering proprieties in the primary image color-space structures.
Temporal Sensitivity & Resolution
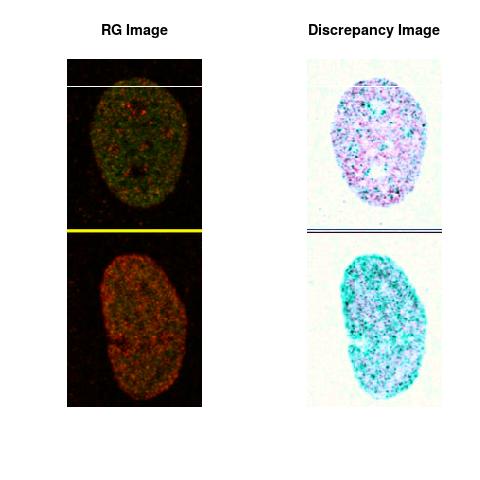
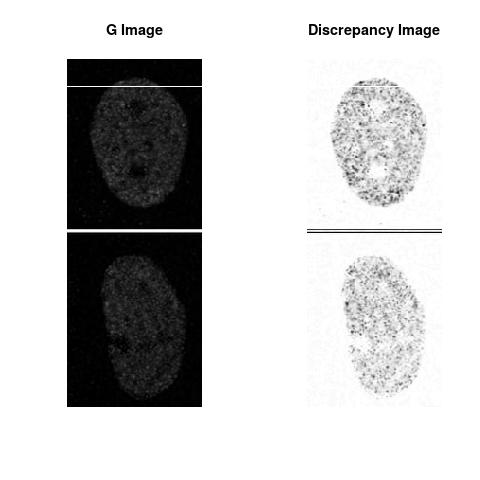
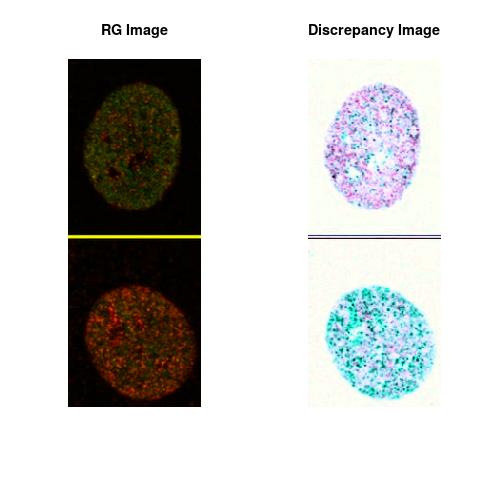
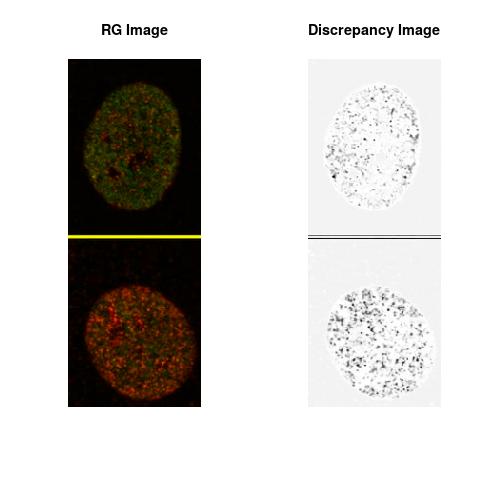
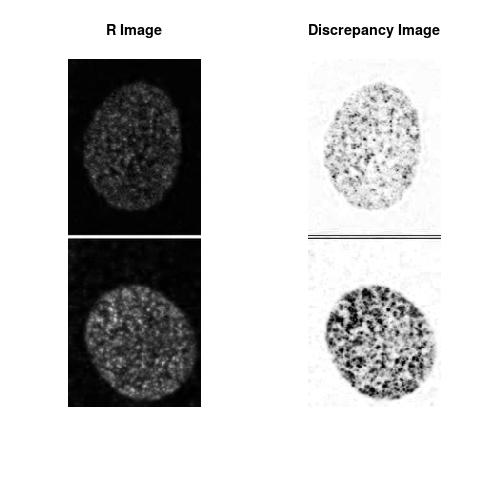
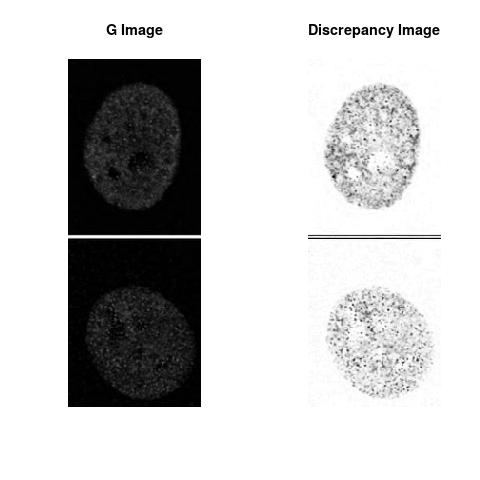
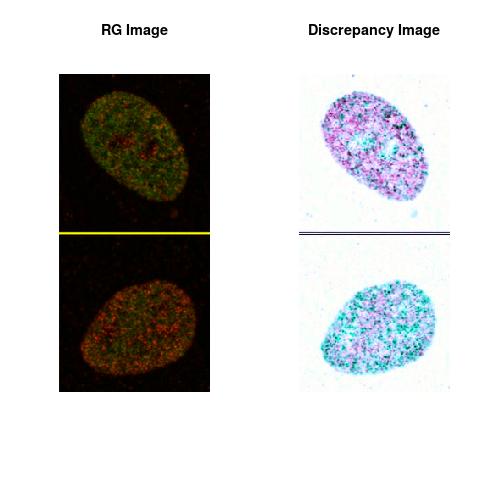
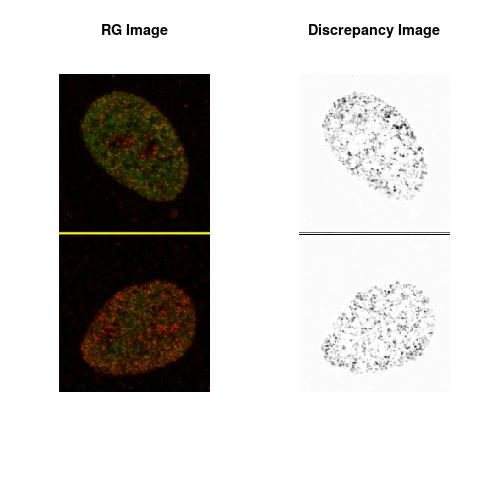
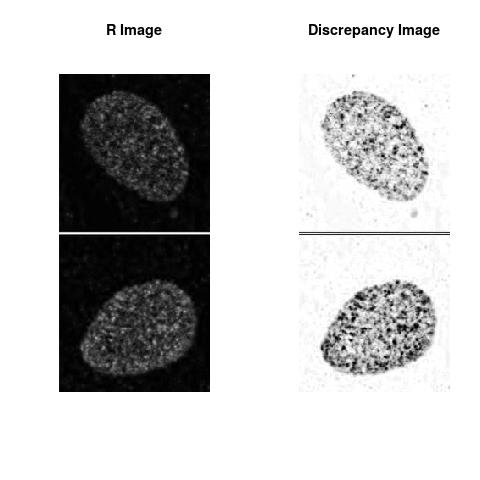
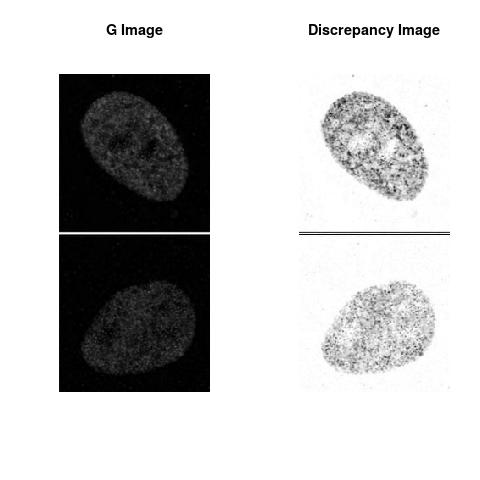
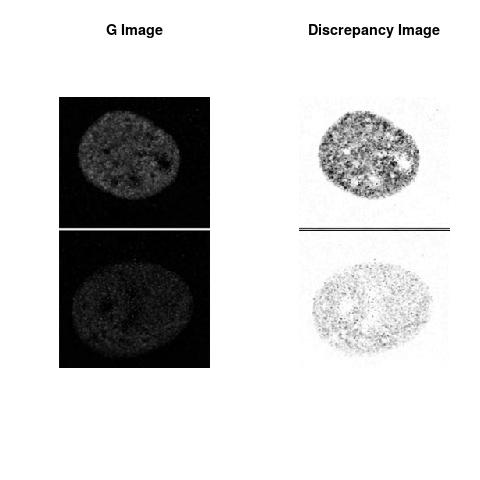
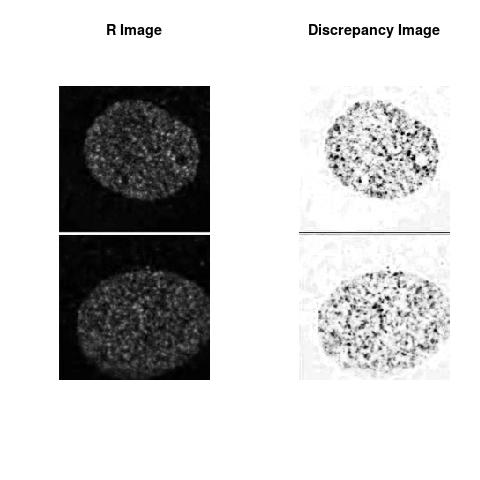
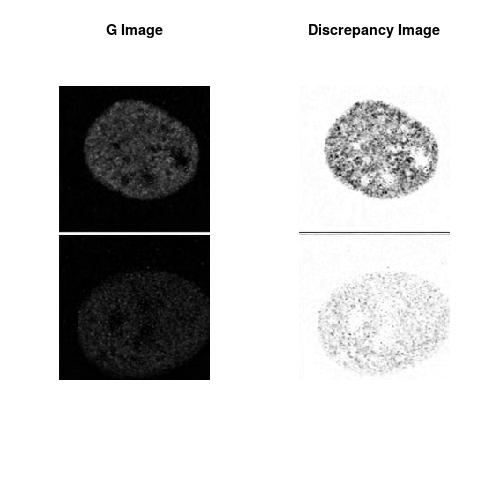
The L2 DDLP provides the Sensitivity Descriptors for the red color and green color in the image content as:The Discrepancy Image has the color-space defined by (Rd,Gd,RGd) where RGd distribution has information about the bi-valency or co-occurrence of H3K4me3 and H3K27me3 marks. The colors and texture in the Discrepancy Image provide insights about the distribution of red and green colors around specific regions of interest (ROI) in the primary image.
For an illustrative purpose, we extracted the images directly from the draft, see Figure 4. The five images named S1,S2,S3,S4,and S5 are used to illustrate our purpose. These images have H3K4me3 ( as green color) and H3K27me3 ( as red color) and each one has two time points: one at early stage 72 hours ( Time 1) and the second after 2 weeks ( Time 2).
We are aware about the fact that the original images are high resolution images. Nevertheless, The extracted images from the publication have the main patterns as in the original images. Our illustration can be conducted on the original images in the same manner.
Combining the color-space contents at Time 1 with Time 2 as one color space content:
One Discrepancy Image is formed by combining the color spaces at Time 1 and 2 to highlight the temporal color changes. The color spaces at Time 1 and 2 are processed as one color space to highlight the discrepancies between Red and Green colors at Time 1 and 2. This process is more efficient to compare the differences in the intensities between Time 1 and 2. The Discrepancy Images are companion to the two combined primary images at Time 1 and 2 and automatically quantify the most informative and relevant features contained in the two combined primary images at Time 1 and 2.STED imaging process is not necessary using the minimal required sampling pixels to capture all information in the sample(labeled nucleus, for instance). The obtained image is constructed via only a makeshift way and its color content is not enough to reconstruct fully the sample. This suddenly discontinued color content is hard to analyze with standard image processing software as it was reported in the publication.
Using L2 DDLP to assess the intensities in combined images( same sample at two different times, for instance) generated by STED microscopy is our proposed approach to assess the Temporal Sensitivity/Resolution of STED imaging, i.e. the image acquisition depends on the optics of the microscope and how the spots are sampled(spatial resolution). Two images obtained with two different sampling spots may resolve differently the sample, i.e. two sampling distances may generate two different indications about the same sample.
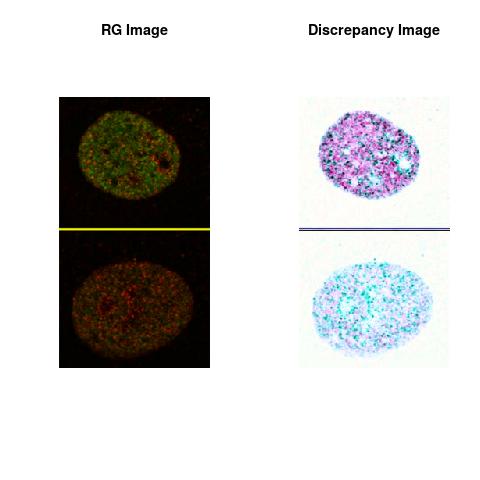
The colored Discrepancy Image of the combined color spaces, in the Figures, uses the RGB Color Space defined as:
This essay illustrates only the Discrepancy Image (Rd,Gd,RGd). Nevertheless, the L2 DDLP generates all possible combinations to form all Discrepancy Images.
Color-map:
Concept Feasibility & Numerical Results
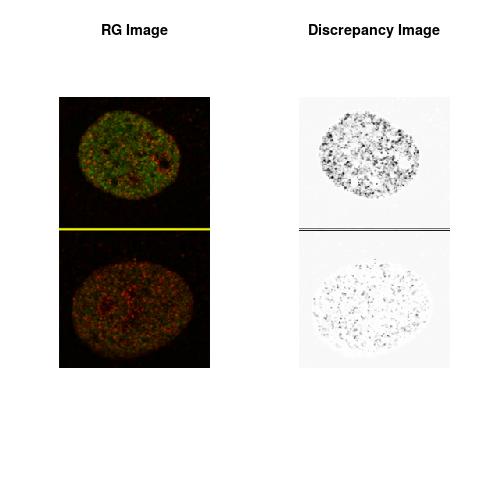
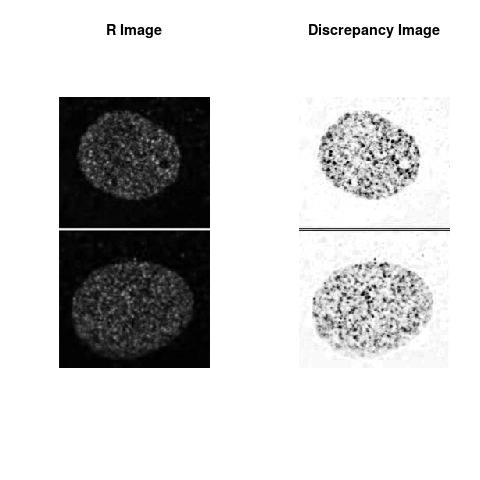
Combining S1(6.1kpa) at Time 1 and 2 : (Rd,Gd,RGd)
RGd
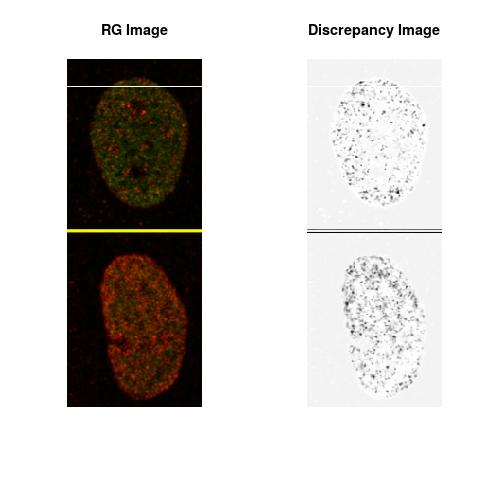
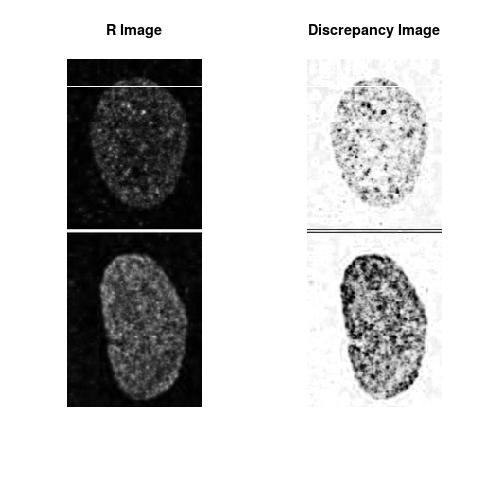
Rd
Gd
Combining S2(10.8kpa) at Time 1 and 2 : (Rd,Gd,RGd)
RGd
Rd
Gd
Combining S3(15.4kpa) at Time 1 and 2 : (Rd,Gd,RGd)
RGd
Rd
Gd
Combining S4(20.00kpa) at Time 1 and 2 : (Rd,Gd,RGd)
RGd
Rd
Gd
Combining S5(2.47kpa) at Time 1 and 2: (Rd,Gd,RGd)
RGd
Rd
Gd
Note
The theoretical part of this work was done when the author was in his PhD thesis (1994-1998), at the University of Savoie, Department of Mathematics, France. The work was shaped toward real applications accordingly to the learned scientific experience.Previous Essays:
- Imaging Flow Cytometry (IFC), Sensitivity Resolution Image Quality, CCD Camera in Time-Delay Integration Using Deep Discrepancy Learning Process (DDLP)
- Imaging Flow Cytometry Using Deep Discrepancy Learning Process.
- Fluorescence Imaging Analysis Using Deep Discrepancy Learning Process
- Image Analytics Using Deep Discrepancy Learning Process.
Author scientific profile:
Statistics and Applied Mathematics for Data Analytics, Identify opportunities to apply Mathematical Statistics, Numerical Methods, Machine Learning and Pattern Recognition to investigate and implement solutions to the field of Data Content Analytics. Data prediction via computational methods to predict from massive amounts of data (Big Data Content). These methods included clustering, regression, survival analysis, neural network, classification , ranking, deep discrepancy learning .
Author: Faysal.El.Khettabi@gmail.com , Living in Vancouver, BC, Canada.
The MIT License (MIT) Copyright 1994-2017, Faysal El Khettabi, Numerics&Analytics, All Rights Reserved.
The MIT License (MIT) Copyright 1994-2017, Faysal El Khettabi, Numerics&Analytics, All Rights Reserved.