This essay is a continuation of:
- YouTube Differential Analytics.
- YouTube Most Popular Videos & Learning Engagement With Bursting Velocity .
Quantitative Analysis.
We have already dealt with the fixed traffic intensity coupled with different policy effect functions in YouTube Differential Analytics. Our empirical analysis showed the existence of bursting phenoma in the collected YouTube data, see YouTube Most Popular Videos & Learning Engagement With Bursting Velocity . Here our emphasis will be on nonlinear phenomena and properties, particularly those with physical relevance when traffic intensity has a time depending busrting trend.In this Figure, the used time variable bursting traffic intensity that is coupled with different policy effect functions.
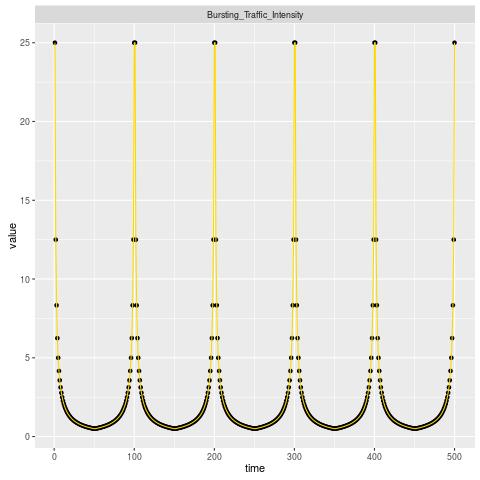
Our first order systems of differential equations(FOSDE) used a policy effect function depending of the state of the system in a non-linear manner. Without some basic theoretical understanding of the nature of solutions, it will be hard to understand when numerical solutions are to be trusted. We considered a time variable bursting traffic intensity that is coupled with different policy effect functions to treat systematically the state feedback of our (FOSDE), see Figure I. The effect of bounded input perturbation, policy effect function, is analysed by solving numerically our FOSDE that feed the founded solutions into the policy effect function, at any given time.
A perfect policy effect function is the one adding no perturbation on the Expected-Profitability. In this case, our FOSDE is a linear system, the exact numerical solution is designed as P0.
A parameter is used – known as a perturbation – that quantifies the deviation from the exactly solvable problem with perfect policy effect function. A series of perturbations have been conducted, P1,P2,P3, and so on. The associated solutions due to the deviations from the perfect policy effect function( an increasing policy effect function are used to damp the Expected-Profitability).
The strong perturbations immediately dislodge the system far away from the observed Expected-Profitability under the perfect policy effect function, click on Realized-Profitability using variable traffic intensities under diffrent policy effect functions to monitor the Expected-Profitability.
Author scientific profile:
Statistics and Applied Mathematics for Data Analytics, Identify opportunities to apply Mathematical Statistics, Numerical Methods, Machine Learning and Pattern Recognition to investigate and implement solutions to the field of Data Content Analytics. Data prediction via computational methods to predict from massive amounts of data (Big Data Content). These methods included clustering, regression, survival analysis, neural network, classification , ranking, deep discrepancy learning .
Author: Faysal.El.Khettabi@gmail.com , Living in Vancouver, BC, Canada.
The MIT License (MIT) Copyright 1994-2017, Faysal El Khettabi, Numerics&Analytics, All Rights Reserved.
The MIT License (MIT) Copyright 1994-2017, Faysal El Khettabi, Numerics&Analytics, All Rights Reserved.